For those that don't know what spectrograms are, try skimming here: http://en.wikipedia.org/wiki/Spectrogram
So, a little background history. (I have a somewhat fair TL;DR at the end, so go ahead and jump there if you want.)
A few years back, the day came when I was fatefully exposed to foobar2000. Before then, I'd just used Windows Media Player for music (I know, I know, but I learned from my mistakes!), so the only visual representations of the music that was playing were those insane pseudo-psychedelic things (I can't remember what they're called, okay?!).
So, as I was customizing foobar, I came upon a delightful discovery: the spectrogram. I had never seen anything like this before. I was completely hooked. Hell, I stopped procrastinating via the normal activities (Facebook, surfing the Internet in general, etc.) and just watched my music for hours (okay, not literally hours SHUT UP). Back then, I only listened to metal, so there wasn't much to study, apart from the vocals. I wanted to be a vocalist in a metal band back then, so I watched the way vocalists specifically stretched out their screams and such, imitating them as exactly as I could -- I would record myself performing the same part, watch my performance on the spectrogram, and then compare it to the original vocalist. Yeah. I also learned to tell all the different layers of the music (kick drums, snares, guitars, vocals, etc.) apart, and soon it was just a cool thing I had around.
When I first got into electronic music (Pendulum, if I remember correctly), I didn't pay too much attention to things in the spectrogram. It was just general music to me, nothing to really study or look at.
But as I got more and more into this new world, more and more interested in how all this worked, I started paying more attention, both audibly and visually.
My growing interest in complextro and Moombahcore especially drove this. How did these artists make these cool sounds? What goes into it? Where... how could I start?
I started my music-producing journey in LMMS. I suppose it maybe wasn't the best place for a beginner (with literally zero experience or knowledge in music theory or anything related, btw). Either way, I was listening to Knife Party's remix of "Unison," and I was studying the spectrogram especially closely. That's when I noticed that the growl synth they used the song looked a lot like the way it'd look if a death metal vocalist growled the same sounds (hence it being called a growl bass, duh, can't believe I never figured that out on my own). I recorded myself growling similarly to it, and what do you know, it looked and sounded kind of similar!
But at this time, I had no idea what the phrase "frequency modulation" meant or that it even existed. Point is, no idea that that's what I should've looked into. My first (ignorant) guess at how to make it sound like it was growling was to try to make two notes of a bass "pinch" into each other -- set the higher note to slide down while the lower note went up. In hindsight, makes barely any sense. But still, Edison didn't invent the light bulb on his first try, right? :P
This is getting really long, so TL;DR I messed around with the spectrogram for a few months listening to brostep, Moombahcore, and electro house, and now I understand some basics of FM bass synthesis and all that.
For those that have possibly not seen what a spectrogram looks like and are also too lazy to look at the Wiki page, I took a screenshot of an example. It's a part of a song with a lot of talking synths, just to show y'all what it is I "studied."
So, anybody else look at music like this? It's also definitely helped me copy or imitate some sounds that I liked, which was supposed to be the point of this whole spiel, but I kind of ranted, which I'm still doing, so this is where this post will end.
Analyzing music visually with a spectrogram
8 posts
• Page 1 of 1
Analyzing music visually with a spectrogram
![]() by Dr. Plague » 13 Nov 2012 23:07
by Dr. Plague » 13 Nov 2012 23:07
Now Nyxus
Soundcloud
Genres of choice: basically just EDM
Strengths: Compressing the shit out of already compressed stuff
Weaknesses: All that other stuff you do in music
Soundcloud
Genres of choice: basically just EDM
Strengths: Compressing the shit out of already compressed stuff
Weaknesses: All that other stuff you do in music
-

Dr. Plague - Posts: 66
- Joined: 12 Nov 2012 19:58
- Location: Locust Grove, VA
- OS: Windows 7
- Primary: FL Studio
- Cutie Mark: I'm human, not a pony
Re: Analyzing music visually with a spectrogram
![]() by Navron » 13 Nov 2012 23:25
by Navron » 13 Nov 2012 23:25
I'd certainly be interested in seeing what a well mixed song should look like on a spectrogram. We all know some understanding of EQ, and can effectively mix at an "ok" level (well, most of us that is), but what exactly should the spectrogram look like?
For example, in one of my better mixed songs, my spectrogram still seems to have most of the frequencies from 50Hz - 2.5KHz, and then tapers off to almost nothing, regardless of not having a high shelf EQ or anything like that.
Is it normal for a song to show more amplitude in the lower frequencies, and less in the higher frequencies? Does the fact of being a higher frequency mean that less amplitude doesn't necessarily mean quieter? Should a song therefore show a slightly downward hill on a spectrograph?
These are the questions I'd really like to see answered by those who are more familiar with the spectrograph.
DAW: Cubase 6.5, Ableton Live 8
Preferred Genre: Industrial/Trance
Hardware: Schecter Diamond Series Bass, Yamaha Acoustic Guitar, BP355 Effects Pedal, Keystudio 49K Keyboard, Akai APC40, Korg nanoKEY2 25k Keyboard
Preferred Genre: Industrial/Trance
Hardware: Schecter Diamond Series Bass, Yamaha Acoustic Guitar, BP355 Effects Pedal, Keystudio 49K Keyboard, Akai APC40, Korg nanoKEY2 25k Keyboard
-

Navron - Global Moderator
- Posts: 955
- Joined: 14 Nov 2011 21:28
- OS: Windows 7
- Primary: Cubase 6.5
Re: Analyzing music visually with a spectrogram
![]() by Dr. Plague » 13 Nov 2012 23:29
by Dr. Plague » 13 Nov 2012 23:29
I am absolutely NO expert on the spectrogram (actually, I'm not an expert at anything but fapping), but going by my own experience, I have to say that it is more normal for lower frequences to show higher amplitude (stealing your phrasing there). If I had to guess as to why, it'd be because lower frequency sounds have higher amplitudes than higher frequency sounds... right? (Legitimately unsure of myself here and am actually asking for confirmation, not being sarcastic~)
Now Nyxus
Soundcloud
Genres of choice: basically just EDM
Strengths: Compressing the shit out of already compressed stuff
Weaknesses: All that other stuff you do in music
Soundcloud
Genres of choice: basically just EDM
Strengths: Compressing the shit out of already compressed stuff
Weaknesses: All that other stuff you do in music
-
Dr. Plague - Posts: 66
- Joined: 12 Nov 2012 19:58
- Location: Locust Grove, VA
- OS: Windows 7
- Primary: FL Studio
- Cutie Mark: I'm human, not a pony
Re: Analyzing music visually with a spectrogram
![]() by the4thImpulse » 14 Nov 2012 00:18
by the4thImpulse » 14 Nov 2012 00:18
Navron wrote:Is it normal for a song to show more amplitude in the lower frequencies, and less in the higher frequencies?
Absolutely, and especially in dance music or other bass heavy/oriented music.
Do a little learning and research in your own time on Fletcher Munson curves to learn exactly why this is but here's the gist of it. Humans have different perceived sensitivity to varying frequency amplitude and varying amplitude levels (dB SPL). What this means is 200 Hz played at 50 dB will sound quieter then 2,000 Hz at 50 dB as we are more sensitive in the mid range then we are extreme lows and highs. Our ears naturally don't have a flat frequency response and to compensate you often see, in those spectrum analyzers, large peaks in the low end (20-200) often following the fundemental of the bass guitar/synth and the kick drum (depending on sound design/style).
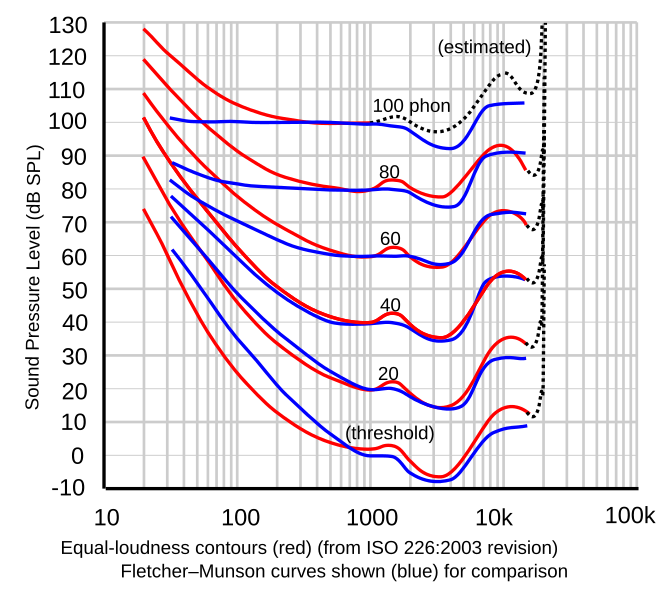
There's a lot to it and its all really interesting stuff so I would suggest looking into it yourself.
Navron wrote:Does the fact of being a higher frequency mean that less amplitude doesn't necessarily mean quieter?
Again its all percieved volume to ours ears, common white noise has a flat frequency response..
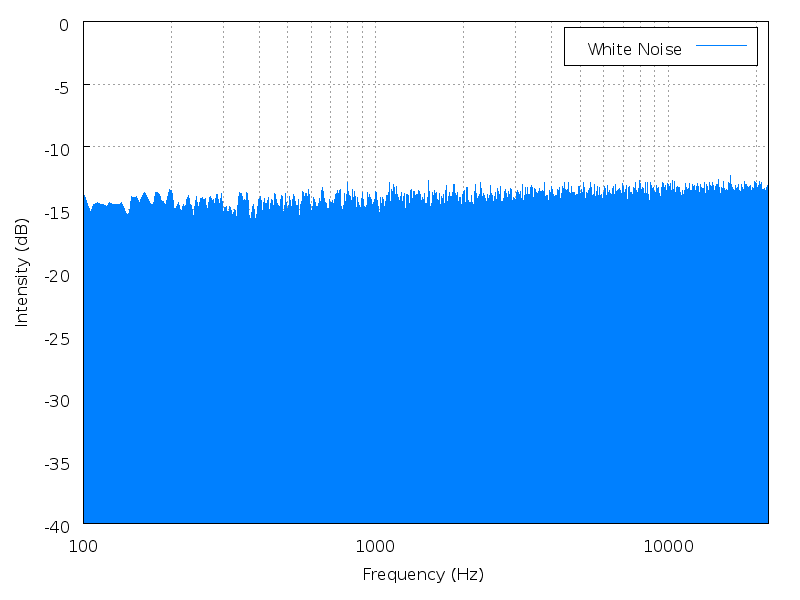
But when you play it you mainly hear a lot of mid-high range and almost no low because of our sensitivity. If you were to put a low pass filter on it and sweep out those mids and highs then the lows will be present although quiet.
Navron wrote:Should a song therefore show a slightly downward hill on a spectrograph?
Well it all comes down to how it sounds but it is very common to see a downward slope on most music. Again in electronic music you will almost always see those slopes.
I hope this explains things a little more clearly, if you want me to expand I will be happy to do so.
4thImpulse's Youtube
Intro to DJing --- Guide on giving feedback --- Most detailed frequency chart you will ever see
Intro to DJing --- Guide on giving feedback --- Most detailed frequency chart you will ever see
-

the4thImpulse - Posts: 1578
- Joined: 22 Feb 2012 17:10
- Location: Kelowna, B.C.
- Primary: Ableton Live 8
- Cutie Mark: Blank flank
Re: Analyzing music visually with a spectrogram
![]() by Dr. Plague » 14 Nov 2012 19:23
by Dr. Plague » 14 Nov 2012 19:23
Lol you said "yet," how optimistic of you toward me. ;)Kyoga wrote:@4th, I don't think they understand the fletcher-munson curves yet. ;~;
BUT this does seem to be an interesting little piece of technology to implement. I'll see what I can do to implement it into my mixing and mastering phases next time.
:D thanks for bringing this up.
It definitely helps me notice if my drums are a little too low in the mix, even if they don't necessarily sound it. Glad to bring it up, I suppose!
Now Nyxus
Soundcloud
Genres of choice: basically just EDM
Strengths: Compressing the shit out of already compressed stuff
Weaknesses: All that other stuff you do in music
Soundcloud
Genres of choice: basically just EDM
Strengths: Compressing the shit out of already compressed stuff
Weaknesses: All that other stuff you do in music
-
Dr. Plague - Posts: 66
- Joined: 12 Nov 2012 19:58
- Location: Locust Grove, VA
- OS: Windows 7
- Primary: FL Studio
- Cutie Mark: I'm human, not a pony
Re: Analyzing music visually with a spectrogram
![]() by the4thImpulse » 14 Nov 2012 22:13
by the4thImpulse » 14 Nov 2012 22:13
Dr. Plague wrote:It definitely helps me notice if my drums are a little too low in the mix, even if they don't necessarily sound it. Glad to bring it up, I suppose!
I don't want to sound rude or mean in anyway but I think it needs to be said: if it sounds good to your ears then there's nothing wrong with it. If your drums sound like they are in the right spot then leave them there even if your spectrum analyzer tells you otherwise. The more your trust your gear to do the things your ears were made for the less you will develop a musical ear you can trust.
I am not saying you shouldn't use tools like the spectrum analyzer's, but please be careful not to blindly follow what it tells you especially when your ear is saying something different. I often use them when I'm eqing so I can more quickly pinpoint the fundamental frequencies or problem frequencies in a track, but I always trust my ear to know exactly where to cut/boost and by how much.
4thImpulse's Youtube
Intro to DJing --- Guide on giving feedback --- Most detailed frequency chart you will ever see
Intro to DJing --- Guide on giving feedback --- Most detailed frequency chart you will ever see
-
the4thImpulse - Posts: 1578
- Joined: 22 Feb 2012 17:10
- Location: Kelowna, B.C.
- Primary: Ableton Live 8
- Cutie Mark: Blank flank
Re: Analyzing music visually with a spectrogram
![]() by Dr. Plague » 15 Nov 2012 15:42
by Dr. Plague » 15 Nov 2012 15:42
the4thImpulse wrote:Dr. Plague wrote:It definitely helps me notice if my drums are a little too low in the mix, even if they don't necessarily sound it. Glad to bring it up, I suppose!
I don't want to sound rude or mean in anyway but I think it needs to be said: if it sounds good to your ears then there's nothing wrong with it. If your drums sound like they are in the right spot then leave them there even if your spectrum analyzer tells you otherwise. The more your trust your gear to do the things your ears were made for the less you will develop a musical ear you can trust.
I am not saying you shouldn't use tools like the spectrum analyzer's, but please be careful not to blindly follow what it tells you especially when your ear is saying something different. I often use them when I'm eqing so I can more quickly pinpoint the fundamental frequencies or problem frequencies in a track, but I always trust my ear to know exactly where to cut/boost and by how much.
First off, not finding you rude or anything, so no worries there. I always appreciate advice/help from people (I mean, that's the whole reason I came to this site, haha), so it's all appreciated!
I agree with you completely, but at the same time, the earphones I'm using aren't good at all. Well, maybe they're supposed to be decent, idk. I looked into them a bit (Kosses, don't remember the specific model, but they were ~$35), and while they're not garbage, they're also not exactly the headphones I wanna be using for music. And since they're earphones, I'm not really sure how well to trust the low-end freqs I'm listening to, so I base my judgments off of not only my ears but the spectrogram too. I especially have to do this for much lower sub-bass sounds, 'cause most of those definitely aren't audible with my earphones (but I can still hear/feel them off my speakers, which is another thing I judge off of).
Of course, having typed all this up, once again, I do agree with you, so don't misunderstand my rant here as trying to argue. Just offering my side of things.
Now Nyxus
Soundcloud
Genres of choice: basically just EDM
Strengths: Compressing the shit out of already compressed stuff
Weaknesses: All that other stuff you do in music
Soundcloud
Genres of choice: basically just EDM
Strengths: Compressing the shit out of already compressed stuff
Weaknesses: All that other stuff you do in music
-
Dr. Plague - Posts: 66
- Joined: 12 Nov 2012 19:58
- Location: Locust Grove, VA
- OS: Windows 7
- Primary: FL Studio
- Cutie Mark: I'm human, not a pony
Re: Analyzing music visually with a spectrogram
![]() by Captain Ironhelm » 16 Nov 2012 11:54
by Captain Ironhelm » 16 Nov 2012 11:54
You can't go solely off of a spectrogram. It can be a nice indicator where frequencies are going, but it's most important to make it sound good to the ear. There's a popular EDM artist (which I won't name for fear of being flamed) that has shot his ears because he didn't take care to ear protection in concerts. His latest songs look fine in a spectrogram, but to the ear they lack the punch they used to have.
So I see a spectrogram as a useful tool, but trying to always stuff your mixes to make it look just-so in a spectrogram might not always be the best mixdown. Just because it looks fine in the spectrograph isn't a magical formula for perfection.
So I see a spectrogram as a useful tool, but trying to always stuff your mixes to make it look just-so in a spectrogram might not always be the best mixdown. Just because it looks fine in the spectrograph isn't a magical formula for perfection.

-

Captain Ironhelm - Posts: 661
- Joined: 22 Apr 2012 22:09
8 posts
• Page 1 of 1
Who is online
Users browsing this forum: No registered users and 7 guests